My Trainer

LOGIQ S8 XDclear 2.0

Introduction

  • Acuisition screen
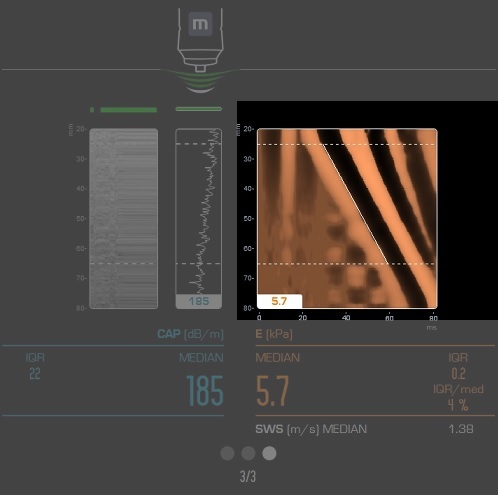
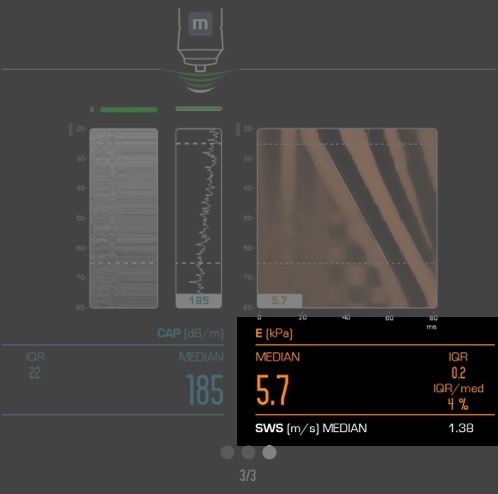
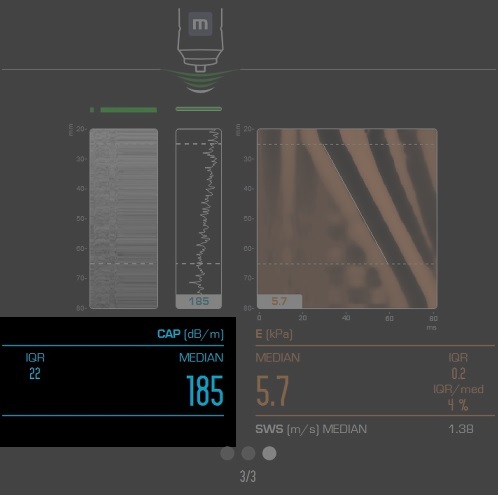
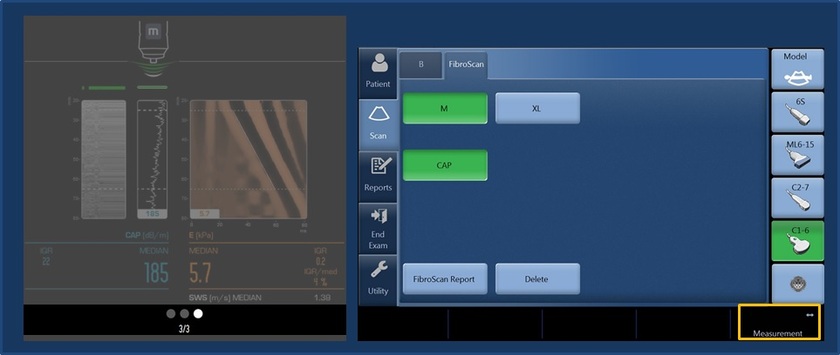
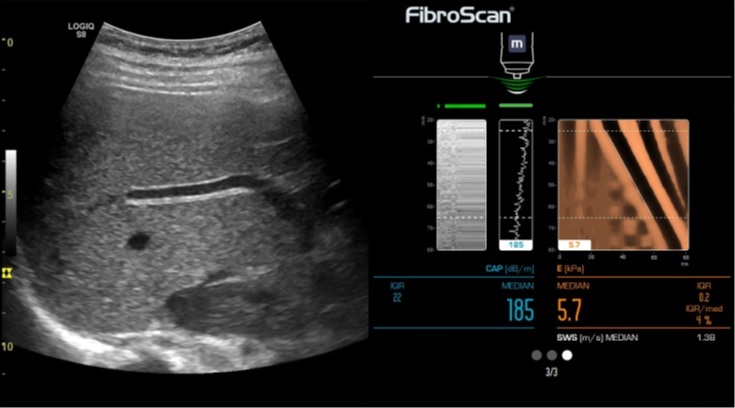
    The FibroScan acquisition screen is divided into a Reference view and a FibroScan view.
    The Reference view can assist the user in determining optimum FibroScan probe placement in order to increase measurement confidence. The last view, before entering FibroScan mode, is frozen and shown as the Reference view portion of the acquisition screen. You can use a still image or a cineloop in the clipboard as the Reference view.

    NOTE: Only B mode, CF mode, Doppler mode, M mode, Contrast, Elastography, B-Flow shall be recalled in FibroScan mode.


  • FibroScan View
    Probe Pressure Indicator
    The probe contains a sensor that measures the pressure applied by the operator to the patient. The pressure is expressed on the monitor with the probe pessure indicator and on the probe with the blue LED. Measurements can only be made when the pressure indicator is in the green zone.


  • Probe Pressure Indicator

  • Liver targeting tool
    The liver targeting tool can be used to position the probe at an appropriate point for measuring the liver stiffness and/or CAP.
    Black : Ultrasound signal is low
    Green : Ultrasound signal is high
    The greener the liver indicator, the higher the quality of the ultrasound signals, and the better the position of the measurement point.


  • TM and Amplitude modes
    These two modes serve to ensure that the probe is correctly positioned to perform a measurement on a sufficiently thick portion of liver, visible throughout the explored depth. Ultrasound emission /reception mode also allows the operator to ensure that the measurement will not be disrupted by the presence of structures not of interest, such as blood vessels.


  • Elastogram
    This image is displayed once the measurement is complete. It represents the levels of liver deformation generated by the propagation of the shear wave as a function of time(horizontal axis in milliseconds) and depth (vertical axis in millimeters).
    The stiffness value is displayed if the measurement is valid.
    The color scale indicates the sign of the deformations (compression or expansion). Black areas correspond to negative deformation and pale areas to positive deformation. The black strip through the image represents deformations associated with the passage of the shear wave, which penetrates progressively deeper with time.


  • Elastogram
    If you perform an invalid measurement, a red line displays in the upper part of the elastogram.
    Invalid measurements are not included on the FibroScan Worksheet


  • Stiffness
    Stiffness median is the median of all valid stiffness measurements.
    Stiffness IQR is re-computed after each new valid measurement.
    IQR median is the ratio of the IQR to the median stiffness.


  • CAP
    Cap Value is displayed only if the CAP option is installed.
    CAP median is the measurement of all valid CAP measurements.
    CAP IQR is re-computed after each new valid measurement.
    CAP value is shown on every valid measurement.


  • Measurement counter
    The measurement counter is displayed at the bottom of the FibroScan view.
    Move through the measurement counter using the measurement-assigned joystick under the Touch Panel.