My Trainer

LOGIQ S8 XDclear 2.0

Time Intensity Curve

  • Time Intensity Curve (TIC) enables the user to perform the following analysis:
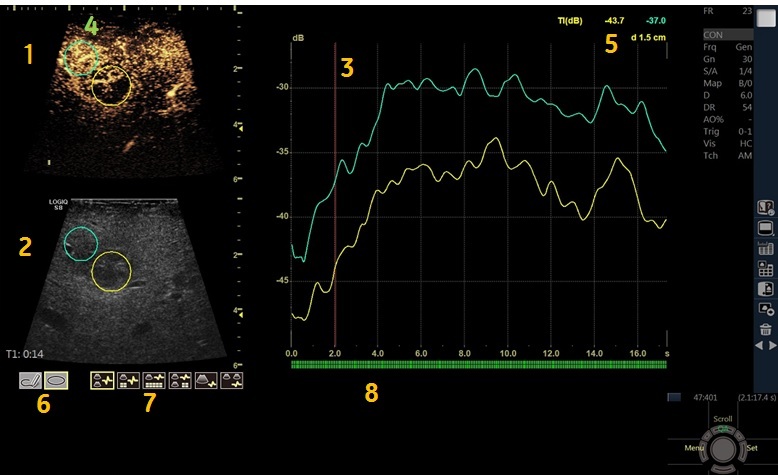
    • Time-Intensity analysis allows instant time-intensity calculation from up to eight regions of interest.
    • Curve fitting analysis for research studies of myocardial contrast agent concentration rates.

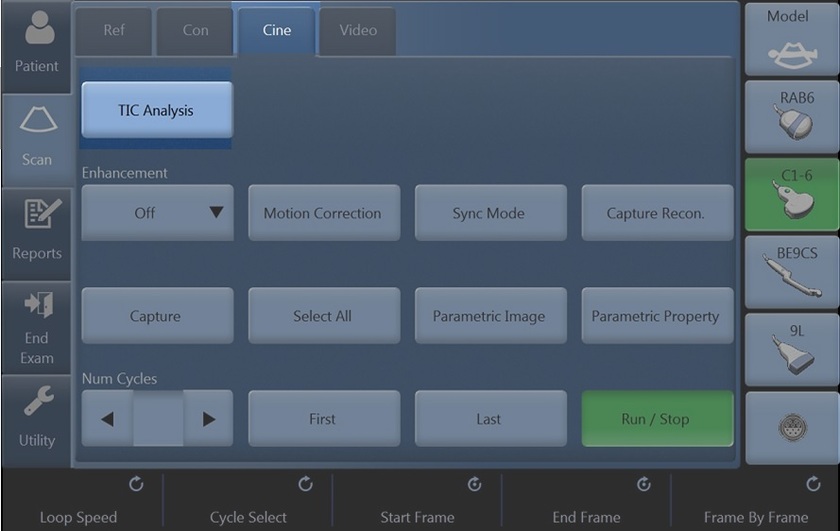
    The basic TIC process works as follows:
    1. Scan the patient after injecting the contrast agent.
    2. Watch the agent flow through the anatomy of interest.
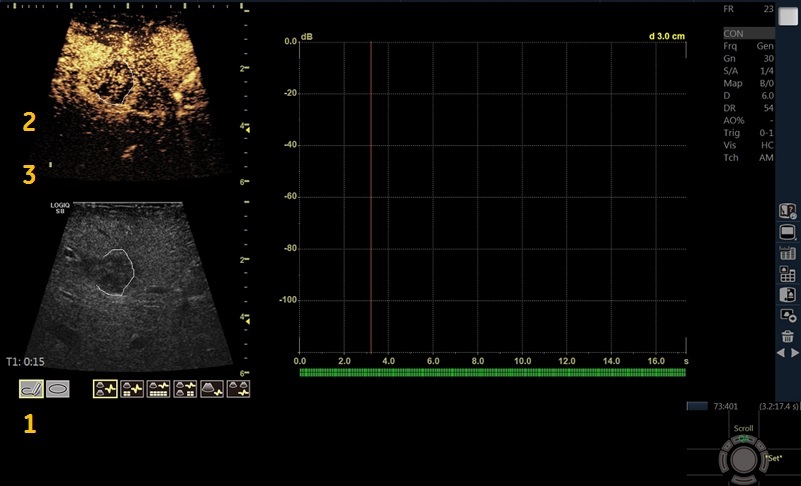
    3. When the desired contrast effect has been visualized, freeze the image and select a range of images for analysis.
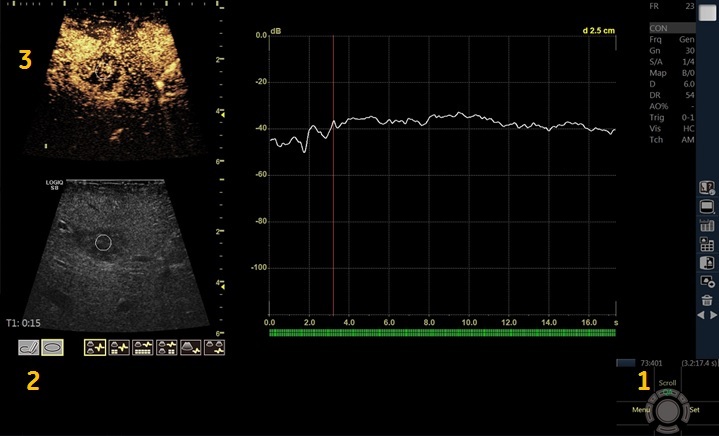
    4. Position an ROI (region of interest) on one of those images where the contrast effect is visible.
    5. The system then calculates the mean pixel intensity within that ROI for all frames in the user designated loop and plots the resulting data as a function of time.


  • 1. Contrast cineloop window
    2. B-Mode cineloop window
    3. Analysis window
    4. Sample area
    5. Time and velocity at cursor position
    6. Sample area tools
    7. Layout icons
    8. Frame marker


  • Trace from a pre-defined sample area (Ellipse ROI)
    1. Press the top Trackball key until the QA trackball assignment is selected.
    2. If necessary, select the sample area Ellipse ROI button (shape icon on the monitor display).
    3. Move the cursor to one of the Cineloop windows using the Trackball. The cursor is changed to a sample area (white circle). A preview of the trace is displayed in the Analysis window.
    4. Press Set to anchor the sample area.


  • Trace from freehand sample area
    1. Select the Freehand ROI button (pencil icon on the monitor display).
    2. Move the cursor to one of the Cineloop windows using the Trackball.
    3. Trace the outline of the desired ROI by moving the caliper with the Trackball.
    4. Press Set to anchor the sample area.
    The sample area is automatically closed and the trace is updated accordingly in the Analysis window.