My Trainer

LOGIQ S8 XDclear 2.0

Color Quantification

  • 1. Acquire a 3-5 sec color clip within the area of interest.

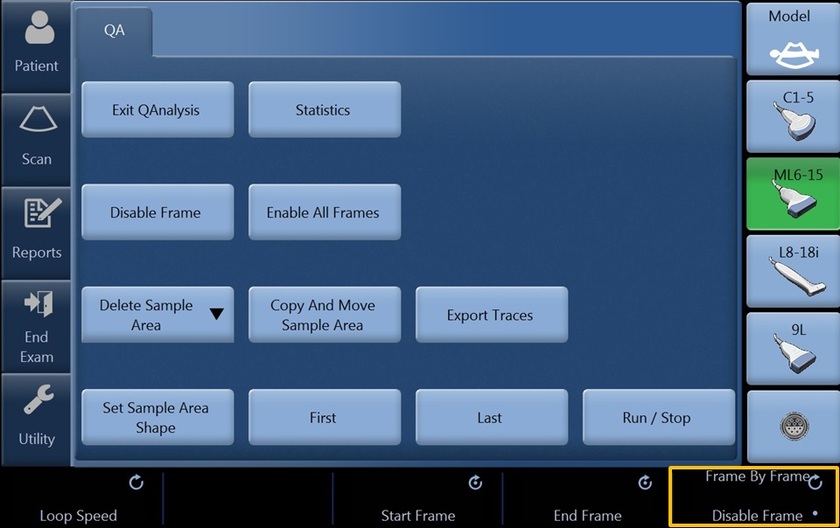
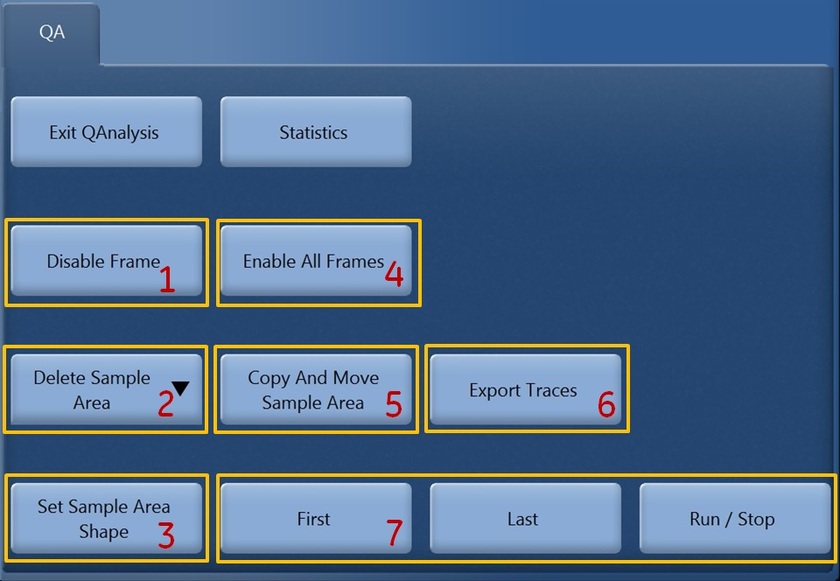
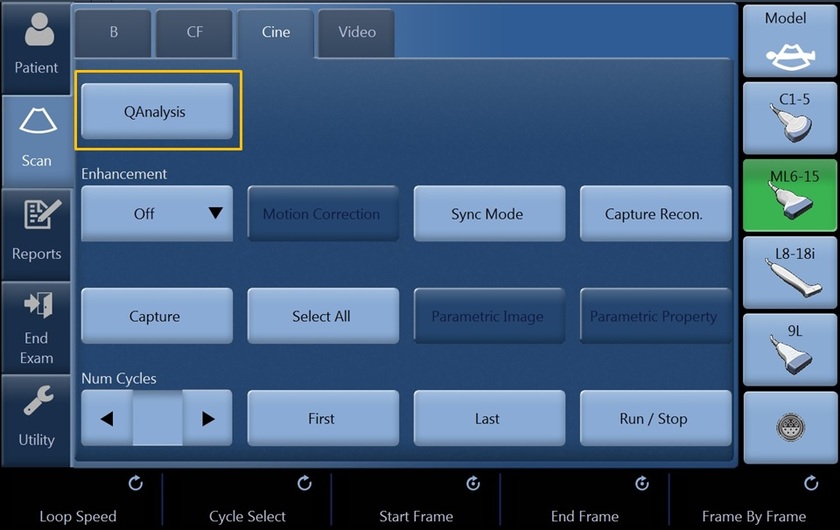
    2. Recall color clip from Thumbnails. On Touch Panel (TP), select Q-Analysis to begin Color Quantification.

    3. System will acquire all color information from clip. Do not push any buttons until system is done acquiring all the information necessary to quantify color data and warning label on bottom of screen is no longer shown. (Cine Computation in progress! Please wait until operation is completed). Note: Avoid using the Quantification Tool on a Color (PDI) clip longer than 400 frames. Color (or PDI) loops acquired without CrossXBeam™ process faster than those with CrossXbeam ON.

  • Select frame to analyze

    1. Once Computation of Color Clip is finished, use pointer to select the desired frame to be analyzed.

    2. Use trackball to move pointer to desired frame and select by using right set key. Note: You can also use: scroll frame by frame, start/end frame (using Rotary Knobs) to select desired frame.

  • Trace desired area to analyze Manual Trace

    1. Using pointer, select Manual icon from the bottom left corner of the monitor. Then move pointer into the color box. Trace around area of interest using set key on soft keys around trackball. Once desired area is set, the acquired color data will be shown on the timeline graph.

  • Ellipsoid

    1. Using pointer, select Ellipsoid icon from the bottom left corner of the monitor. Move pointer into color box. The ROI size can be adjusted by using the body pattern and ellipse knob on the operator panel. The default shape can be adjusted by using the Set Sample Area Shape on the TP. Once the ellipsoid is placed within desired area, the acquired color data will be shown on the timeline graph. Note: Color Q-Analysis provide tools for semi-quantitative assessment of inflammation in joints. For follow-up exams, use Ellipsoid ROI if you want to save ROI size from study to study.

  • Timeline graph

    1. For statistics calculation, press “Statistics” button. The ratio is calculated and the area is shown.

    2. The ratio pertains to the number of Color Pixels compared to the overall number of pixels within the specified ROI (Region of Interest).

    3. This ratio then correlates with the desired frame that is selected within the timeline. Time pertains to the selected frame (blue line) within the color clip.

  • Note: Up to 8 ROI’s may be placed on the image and will be displayed on the graph simultaneously. At anytime, Run/Stop can be selected on Touch Panel (TP) to replay clip.

    4. Using pointer and trackball, select icon below area to change between short and long form.

  • 5. Short Form provides statistics for one selected frame. Within the frame selected, a ratio is given which includes the number of color pixels compared to total number of pixels within the Region of Interest.

    6. Long form searches entire loop within the desired ROI for the individual frame which includes the maximum ratio and the individual frame which includes the minimum ratio. The corresponding minimum and maximum ratio values are then displayed on the screen in addition to the short form information. Note: Once Statistics is selected on TP, Timeline Graph will default to Short Form.

  • Disable frame

    (1) Ability to disable unwanted frames within timeline. For example, frames with too much flash within image. Delete sample area

    (2) Ability to delete current sample volume or start over by deleting all sample areas previously traced. Set sample area shape

    (3) Effective in providing physician with a more consistent follow up exam.

  • Enable all frames

    (4) Easy way to make all frames active again. Copy and move sample area

    (5) Gives clinician a copy and paste function. Export traces

    (6) Exported traces may be put into an excel graph. First/Last/Run/Stop

    (7) Ability to review clip from beginning to end.